Chapter 08

p5.js in the Media Studies Classroom

by
J.J. Sylvia IV

Author Biography

Many scholars have explored the relative ease of learning programming languages such as Processing and p5.js and have begun to create their own critical and creative projects using these languages (consider Processing Community Day). However, these works have not adequately addressed how to implement p5.js into classroom assignments for courses in which students are not required or expected to have a background in coding or computer science. This case study explores the feasibility of implementing p5.js in a coding project for students with no prior coding background knowledge, paying special attention to approaches in the media studies discipline. p5.js is a JavaScript library similar to Processing, which aims “to make coding accessible for artists, designers, educators, and beginners, and reinterprets this for today’s web” [1]. I have selected this tool because it offers a wide variety of additional code libraries that provide multimedia functionality and it is designed to be accessible to beginners.

Specifically, I explore the implementation of major assignments that require students to both learn and use p5.js as a tool for a media studies-related group project. The data that I draw upon include direct observation of students and collection of artifacts and texts such as assignment instructions, rubrics, and examples of student work. The case study involves the implementation of p5.js in three different settings: an upper-level media studies course at a large research-intensive public university, an introductory-level media studies course at a small regional public university, and at a Digital Humanities Workshop open to public registration at a research university.

Although p5.js is not a language that is itself in demand in the larger job market, it is nonetheless an important language both because of what it allows students to do in terms of media and the way it can be introduced in the context of a single semester to students who have no prior coding experience. Both of these elements are connected to the larger history out of which the language itself developed. Reas and Fry (2018) explain that their motivation in 2001 for creating Processing, a predecessor to p5.js, was developing a way to bring the work occurring at MIT into the larger world by blending graphic design with computer science:

A Processing program is called a sketch. This is more than a change in nomenclature, it’s a different approach to coding. The more traditional method is to resolve the entire plan for the software before the first line of code is written. This approach can work well for well-defined domains, but when the goal is exploration and invention, it prematurely cuts off possible outcomes. Through sketching with code, unexpected paths are discovered and followed. Unique outcomes often emerge through the process.

Thus, Processing was intended to offer a new approach to coding that focused more on artistic and inventive approaches in a way that was easy to begin using but still afforded the ability to scale up into more complex projects. The developers took care to cultivate a community dedicated to the language that has continued to grow, especially after the source code was shared on GitHub in 2013 (Reas and Fry 2018). The original Processing project has branched off into several other projects, including p5.js, which has been led by Lauren McCarthy as a way to adapt Processing for today's web browsers.

This approach to coding makes p5.js a valuable tool for the media studies classroom. First, it allows students to quickly dive into programming that produces visual results after just a few lines of code. This relatively low learning curve helps motivate continued learning of the language. Additionally, p5.js helps students better understand and develop some of the logic skills associated with programming without also requiring them to develop as much technical know-how as many other programming languages. This code-based way of thinking is itself a valuable skill for students to develop. Bringing all of this together, students can relatively quickly and easily utilize the p5.js programming language in order to develop inventive and creative media studies related projects that offer a blending of theory and practice.

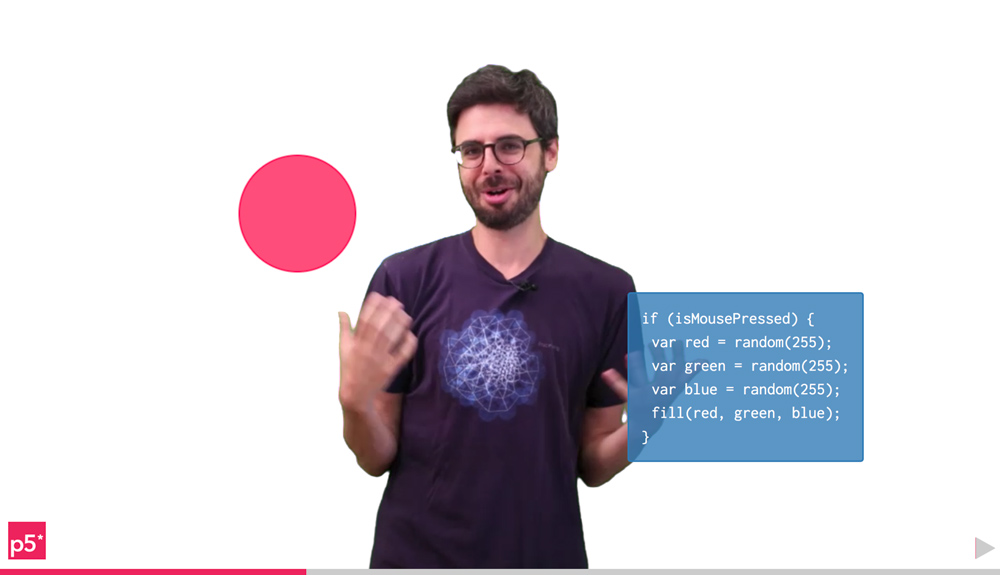
An example will make clear how quickly an interactive project can be created and run using p5.js. The gray box below is an interactive p5.js canvas that allows you to draw lines on it by clicking and dragging the mouse and is an example on the p5js.org website. You can try this for yourself in Figure 1, below.

Fig. 1 p5.js Interactive Example

The code for this project is straightforward and simple. I've provided an annotated version below (Figure 2), where the commented lines that begin with two slashes ("//") explain what the following line of code does.

Fig. 2 Code for Figure 1 with Comments

You may notice that it actually took more text to explain the code than it took code to create the interactive element. You can see the code by itself in Figure 3.

Fig. 3 Code for Figure 1 without Comments

This quick history and overview of the language is meant to demonstrate why it is so beneficial in the classroom setting. A few lines of code can quickly get an interactive web environment up and running. A few more lines allow us to create further drawings or bring in additional media such as photos, videos, or even CSV databases.

Overview of Courses

This case study compares the use of p5.js in two different undergraduate courses and a Digital Humanities workshop open the general public. Each of these offers a different take on how to implement p5.js.

Course A

Course A was an upper-level elective topics course at a large research-intensive public university and was cross-listed between the English and Communication departments. The course description is: “Study of the influence of emerging technologies on rhetorical theory and practice. Rhetorical analysis of texts, including visual and audio texts. Invention and construction of digital media texts as a means of engaging rhetorical theory and analysis. Topics vary to adapt to emerging technologies and changing vernacular practices.” The version of this course that featured the p5.js assignment was titled “Big Data and the Rhetoric of Information.”

Course B

Course B was an introductory level course at a small regional public university in a Communications Media department. The course description is: “The course surveys the communication field its major theories and history as well as examines, professionally and critically, the current structure of the media industries and their cultural, economic, regulatory, social and technological systems.”

Course C

Course C was a Digital Humanities workshop offered at a public research university and open to registration by members of the public. This workshop was unique from the others courses in that it solely focused on creative coding and lasted only one week. A syllabus of the workshop is available to view. The objectives for the course included developing an understanding of the unique elements of generative design, learning the basics of p5.js, and developing a personal project.

Strategies for teaching coding practice/ideas

When I began using p5.js, it required a downloadable editor that needed to be installed on students’ computers. Part of the first day of instruction was usually related to walking through these steps to make sure students had a usable editor installed and ready to use. However, there is now an easy-to-use web editor available that allows students to immediately leap into creating sketches. If they want to save their work they can create an account with the editor and access their code from anywhere.

For each course, I began by showing the Hello p5.js video, as it quickly and visually demonstrated the power of the coding language and gave a preview of the code that was being used to make various interactive elements appear on the screen. This video immediately made apparent the results that were available through p5.js, as seen in Figure 4 below.

Hello p5.js video
Fig. 4 Screen shot of "Hello p5.js" video from http://hello.p5js.org

In courses A and B, I introduced the programming language through guided practice in the classroom. I devoted one class period to setting up p5.js so it was ready to use, trying a few beginning programs to make sure students knew how it works, and finally pointed to resources for further independent learning. This instruction was fairly minimal and assumed that students would be working outside of the classroom to continue learning the language. Students were invited to attend office hours for further help and/or instruction related to p5.js.

Course C was unique in that we spent four full days working together. After the first day of instruction, I quickly realized that workshop participants would need more hands-on time to complete their projects. Because students were working on such different projects, they each needed very different programming resources. Although there were some common coding practices that helped everyone, each participant really needed individual help applying coding practices to their particular project. For this reason, I shifted to a shortened morning lesson on a new programming skill and then spent the rest of the morning and afternoon working individually with students to develop their code. This approach worked well in that it helped students advance their projects more quickly overall. However, when students got stuck and weren't sure what step to take next, there was down time incurred while they waited for me to be able to assist with their code. One other major difference in my approach to teaching this course was that we spent time in class specifically covering and practicing the iterative and generative nature of programming and how that applied to computer-based art.

Overview of assignments

Course A

Assignment A was designed primarily as a data visualization project that was worth 20% of the total course grade. It was designed to align with a Code+Art competition that the university library launched during the semester the class occurred. The syllabus description read:

Work with 2-3 classmates to create a data visualization that makes a complex topic digestible in visual and written form. These will be created following the guidelines of the NCSU Library Code+Art competition: https://www.lib.ncsu.edu/codeart. Actual submission to the competition is not required for the course, but is highly encouraged.

In addition to the requirements of the competition, the project assessment used the same criteria used to judge the entries in the competition. The type of submissions allowed included:

What are we looking for? We are looking for attractive visualizations that are created with a computer. Submissions in the following categories will be accepted:

  • Data visualization / data art
  • Generative art
  • Procedurally generated environments (game environments, for example)
  • Virtual or augmented reality experiences
Note: We are especially interested in “massively responsive” web-based work that could be displayed on the Hunt Library video walls. (NCSU Libraries Code+Art Visualization Contest)

The library provided both resources for learning how to code and the set of criteria for judging the submissions:

Criteria for Judging Entries Judges may consult with outside specialists if their expertise is necessary to fully judge a project.

  • The entry is a visualization that the submitter(s) created with a computer.
  • Audience appeal: The entry (and its data, if it is based on a data set) will appeal to and engage a large audience.
  • Spatial relevance: The entry demonstrates a grasp of the physical location of the video walls and uses the large-scale display element to the advantage of the piece.

(NCSU Libraries Contest Rules and Regulations)

NCSU Libraries Code+Art Resources
Fig. 5 NCSU Libraries Code+Art Resources: NCSU Libraries website screenshot, 2018.

Course B

Assignment B was significantly different from the original in that it occurred in an introductory level course and required the use of p5.js rather than giving an option. Additionally, rather than creating a more straightforward data visualization, I challenged the students to take a Digital Humanities approach to a topic in media studies. Such an approach uses the iterative nature of coding to facilitate a generative artistic design as part of a visualization that can raise different questions than more traditional data visualizations such as charts or graphs. The assignment was worth 25% of the overall grade and was framed in the syllabus in the following way:

(250 pts) Creative Coding Project: Data visualization can consist of much more than charts and graphs. What are the unique powers available through code/art and how might we leverage these for a digital humanities approach to communication and media studies? Understanding the power of art to force a confrontation with difficult theoretical questions opens an important area of exploration. This project will be completed in groups of 2-3 students. No prior programming experience is assumed. We will be using p5.js, a language designed for artists, educators, and beginners.

The rubric for this assignment was adapted from one used by my colleague and HASTAC (Humanities, Arts, Science, and Technology Alliance and Collaboratory) mentor, Paul Fyfe, developed for critical making projects. It assessed the following criteria:

  • Appropriateness of medium, significance of issues, and depth of complexity explored
  • Originality of idea, risk-taking and exploration of new dimensions of problem or unexpected results
  • Value of claims as way of understanding and broadening medium, original and constructive conclusions
  • Easy to understand, free from errors

Course C

This course did not feature any formal assessment. Instead, students were asked to develop a personal project related to current interests or research on which they were already working. This provided the most open format of all the courses.

Student Work

Course A

Most of the students in this course submitted their work to both the library's Code+Art competition and as interactive exhibition titled "Big Data Visualizations and the Rhetorical Act" at the Carolina Rhetoric Conference. The exhibit was hosted in a 360-degree visualization room (Figure 6), allowing all of the data visualizations to be displayed simultaneously. This provided students with two opportunities have their work displayed publicly and the chance to discuss their projects with other scholars (Figure 7).

Carolina Rhetoric Conference presenation
Fig. 6 Carolina Rhetoric Conference presentation in 360-degree visualization studio
Student discussing work with visiting scholar
Fig. 7 Student discussing work with visiting scholar

Two of the groups in the class chose to use p5.js as opposed to Tableau. Of note, although the theory portion of the course related to big data, student visualization projects featured comparatively small data sets, due most importantly to lack of access to the computing power needed to visualize true big data.

The first project visualized the Google search frequency for the term "selfie" between 2004 and 2016, representing it by the size of a circle (See Fig. 8). Users could interact with the visualization by dragging a slider that allowed them to select individual months in this date range. The code for this project is provided in Figure 9. The second project used data collected by the university about how often students participated in both study abroad and exchange programs. The p5.js portion of the project created an animation that slowly tallied how many students participated in each type of activity by representing each with a plane. A red plane represented programs with the students' own university, while white planes represented exchange programs with other universities. However, the group also decided to include several Tableau visualizations, showing for example, the most popular locations for study abroad and exchange programs (See Fig. 10).

Googling
Fig. 8 Googling "Selfie" Throughout the Years Screenshot
Fig. 9 Code for Google "Selfie" Project
Tableau Visualization
Fig. 10 Study Abroad and Exchange Program Locations Tableau Visualization

Overall, student work for this assignment was successful, and students had several voluntary opportunities to display their work. They took advantage of these opportunities and gained new experience with creative coding and data visualization.

Course B

This course featured the most challenging version of the assignment, as it asked students to use p5.js the most creatively. Additionally, the task consisted of students who were majoring in areas such as game design and film/video. Perhaps because of this, I found that students gravitated toward a narrated animation approach with p5.js. This provided interesting results.

The first example is a sketch that offered commentary on YouTube's evolving demonetization process. It anthropomorphized the YouTube monetization algorithm and explored several problematic examples (See Fig. 11). The creation of this sketch included 2,590 lines of code (See Fig. 12).

Fig. 11 YouTube Demonetization Coding Project
Fig. 12 YouTube Demonentization Code

A second project from this course offers a commentary on violence in video games, making the implicit argument that the more violence you participate in through video games, the more desensitized one becomes to both the violence and everything else around them. In the interactive sketch they created, a user can press buttons on the keyboard to change colors on the laptop screen. Alternatively, clicking the mouse button is meant to represent participating in a violent video game action. Notably, only the violent actions increase your score. However, the more you click to participate in the violence, the darker all of the colors become, even those unrelated to violence. Figures 13 and 14 feature a video of the sketch and its related code.

Fig. 13 Media Violence Sketch by Anthony Montaquila
Fig. 14 Media Violence Code by Anthony Montaquila

Course C

Course C featured students creating coding projects related to work they might already be doing either professionally or as a student. However, as noted above, students began by developing their coding skills creating straightforward iterative-based art work. Examples of this work are included in Figure 15.

iterative art 1 iterative art 2 iterative art 3 />
                    </div>
                    <figcaption>Figure 15. Examples of iterative art by Alicia Chester, Jodie Salter, and Meaghan Barry</figcaption>
                </figure>

                <p>Next, students moved on to data driven projects. The majority of students in this course were most interested in textual analysis. Students used a variety of library add-ons and shared code snippets to create their projects. Conceptually, one hurdle was trying to make use of the iterative nature of p5.js by understanding what it could offer that wasn't available in more traditional data visualization software. Some chose to approach this from the perspective of a creative aesthetic display in which the size and color of words was based on data while the position was random <b>(See Fig. 16)</b>. Another approach added interactive textual analysis features. Using the same text, they created two ways to analyze the material. The first approach had them hand code particular keywords. When these words were clicked, they appeared highlighted with the surrounding words that appeared before and after them for context <b>(See Fig 17)</b>. The other example allowed a user to type in any keyword and the program would return a number that reflected how many times the word appears in the source material <b>(See Fig. 18)</b>.</p>
                
                <figure class= Aesthetic data display
Figure 16. Aesthetic data display by Alicia Chester
Textual analysis
Figure 17. Textual analysis example 1 by Joanna Szurmak
Textual analysis
Figure 18. Textual analysis example 2 by Joanna Szurmak

Overall, students were happy with the workshop, and many expressed an interest in continuing their work.

Suggestions for class/assignment revisions going forward

By teaching this content in three different ways across three different courses, I have developed some practical suggestions that should be helpful in adopting a similar assignment in other classrooms.

First, there were pros and cons for each format. While the workshop allowed for more immersive study, the short time period didn't allow participants enough time to develop advanced projects within the workshop itself. One major con related to including a coding assignment in the traditional classroom is that it requires much more effort to "sell" the activity to students. Specifically, care needs to be taken to explain why we're spending time on a coding project in a non-coding class instead of covering additional material that might seem more relevant to students. The framing of the assignment is extremely important for student buy-in and engagement of the coding work. In some ways, this has been the most difficult challenge for me. Many communication students, especially those in media production concentrations, find it hard to imagine when they might use coding skills in their professional careers. A significantly stronger explanation about the reason for and benefits of such a coding project would help prevent at least some of this initial resistance.

I highly recommend that one creates space for teaching one-on-one, because students will get stuck and not be sure how to proceed. This could be achieved either through taking turns working with students in the classroom or by having students visit during office hours for help. In the classes where we did not have as much time to work in class, students who visited during office hours typically produced stronger final products.

Additionally, it's important to consider whether or not to assign this as a group project. While this does tend to lighten the workload and give students the opportunity to divide tasks between them, it is possible that without instructor intervention, the person who is most comfortable with coding will get stuck doing all of the work. While this is a possibility inherent in any group work, I've found that even normally highly motivated students can recede into the background if there are others in the group who are more comfortable with the coding process.

Next, I recommend that there be a concrete goal in mind for the visualization. Although a major benefit of a language such as p5.js is that it allows so much creativity, this can be problematic in terms of a course, as students can be overwhelmed, especially if it is their first time coding. One strategy that worked well in Course A was providing a particular set of data and asking students to create a visualization based on that information. Although I allowed groups to use data beyond the set I provided, having a recommended data set was particularly helpful for many groups who were not quite sure what they wanted to do.

Finally, students who have not coded before can be overly optimistic about what will be possible to achieve within the scope of a semester. This stems from not understanding the amount of coding it might take to achieve a particular outcome. Giving feedback on project ideas early in the process, ideally before the coding has even begun, can help to set and maintain expectations, preventing students from taking on too little or too much in terms of their project. With properly managed expectations, students with no prior experience can create strong projects.

"

Chapter 8

To cite this article:

MLA: Sylvia IV, J.J.. “p5.js in the Media Studies Classroom.” Coding Pedagogy, edited by Jeremy Sarachan, 2019, ch. 8, http://codingpedagogy.net. Accessed 1 Apr. 2020. [update access date]

APA: Sylvia IV, J.J.. (2019). “p5.js in the Media Studies Classroom.” In J. Sarachan (Ed.), Coding Pedagogy, ch. 8. Retrieved from http://codingpedagogy.net.

Chicago: Sylvia IV, J.J., “p5.js in the Media Studies Classroom.” in Coding Pedagogy, ed. Jeremy Sarachan, ch. 8, Coding Pedagogy, 2019. http://codingpedagogy.net.

"
  1. Processing Foundation. “p5.js”, p5.js.

Comments

Last: Chapter 7